Japanese candlesticks are a type of technical indicator used in financial markets to represent the price action of an asset over a certain period of time. They are widely used by traders and investors as a tool for making informed decisions about buying and selling securities.
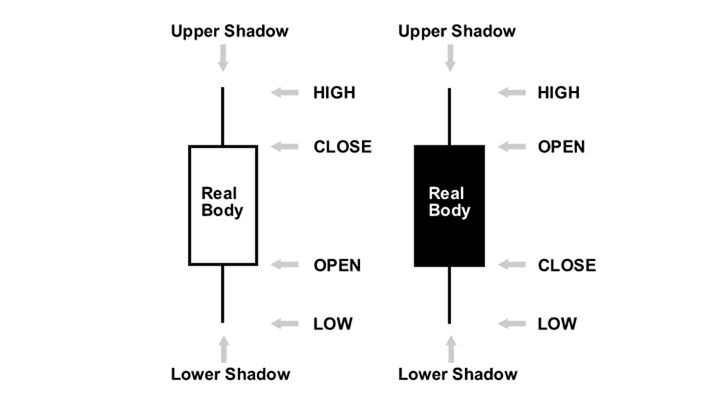
The best way to explain is by using a picture:

A Japanese candlestick is formed by a rectangle and two thin lines (the “wick” and “tail”) at either end. The rectangle is known as the “body” of the candlestick, and its color is used to represent the price action over the period of time being analyzed. If the closing price is higher than the opening price, the body of the candlestick is typically colored green or white to indicate a bullish trend. If the closing price is lower than the opening price, the body of the candlestick is typically colored red or black to indicate a bearish trend.
The wick and tail of the candlestick represent the high and low prices, respectively, over the period of time being analyzed. The length of the wick and tail can provide valuable information about the volatility of the asset during that time. A long wick and tail indicate that the asset experienced a significant price movement during the period, while a short wick and tail indicate that the asset was relatively stable.
There are several different types of Japanese candlesticks that traders and investors use to analyze price action. The most commonly used types include the doji, hammer, and shooting star.
A doji is a candlestick with a small body and no wick or tail. It typically indicates that the market is in a state of indecision, with neither buyers nor sellers having the upper hand.
A hammer is a candlestick with a small body and a long tail. It typically indicates that the market has experienced a downward trend, but that buyers have begun to enter the market and push the price back up.
A shooting star is a candlestick with a small body and a long wick. It typically indicates that the market has experienced an upward trend, but that sellers have entered the market and pushed the price back down.
To use Japanese candlesticks effectively, traders and investors need to understand the patterns and signals they provide. By analyzing the patterns and signals, traders and investors can make informed decisions about when to buy and sell securities.
In conclusion, Japanese candlesticks are an important tool for technical analysis in financial markets. They provide valuable information about the price action of assets over time and can help traders and investors make informed decisions about buying and selling securities. By understanding the different types of Japanese candlesticks and the patterns and signals they provide, traders and investors can improve their chances of success in the markets.
